Thursday, January 29, 2015

Nominal GDP vs Real GDP


Nominal GDP
- it is the value of out put, produced in current prices
*it can increase from year to year if out put or price increases


Real GDP
-It is the value of our put produced in constant or based year prices
* it is adjusted for inflation
*it can only increase from year to year if out put increases

Price Index - Measures inflation by tracking changes in the market basket of goods compared with that, in a base year

Price of market basket of goods currencies/ Price of market basket of goods in based year x 100

GDP Deflater
- A price index use to adjust, from nominal to real GDP
Nominal GDP/ real GDP x 100


  • in the base year GDP deflater is always equal to 100, for years after the base year the GDP Deflater is greater than 100


How do we calculate inflation rate?
New deflater= Old deflater/ Old deflater x 100

How to Calculate Budget


How To Calculate


 Budget
Government purchase of goods and services + Government transfer payments - government tax and fee collections

If you have a positive number it is a budget deficient
If you have a negative number it is a budget surplus

Trade
Exports-Imports

GNP
GDP + Net Foreign factor Income

NNP (Net National Product)
GNP-Depreciation

National Income
GDP-Indirect Business taxes - Depreciation - Net Foreign Factor Payments
or
Compensation of Employees + Proprieties + Corporate Profit + Rental Income + Interest Income

Disposable Personal Income (DPI)
NI (National Income) - Personal Household Taxes + Government Transfer Payments

Wednesday, January 28, 2015

Expenditure Approach

Expenditure Approach
- add up the market value of all domestic expenditures made on all final goods and services in a single year
C + Ig +G+ Xn= GDP

Income Approach
- add up all the income earned by house holds and firms in a single year

Statistical Adjustment

GDP-  W+R+I+P+ 
- wages
- rents
-interest
- profit


Wages
- compensation of employees
-salary supplement
  • Pision
  • health
  • insurance
  • welfare
Rents
- ten tints to land lords
-lease payment by a corporation for the use their space

Interest
-money paid by private business to the supplies of loans used to purchase capital

Profit 
- corporate profit
-corporate income taxes could show up as dividends
-undistributed corporate profits.

Gross Domestic Product

Gross Domestic Product
  • economist collect statics on production, in came investment and savings.
  • this is called national income accounting
  • most important measure of growth is GDP
GDP- Total Dollar value, of all final goods and services
  • produce within a countries borders within a given year
GNP (Gross National Product)
- the total value of all final goods and services, by citizens of that country, on its land or foreign land 


WHAT IS NOT INCLUDED IN GDP

Intermediate Goods
- no multiple counting, only count final goods
-the car manufacturer cant count the extra parts

- cant  count second hand or used goods

Non Market Activity 
-selling drugs
-baby sitting
-volunteering 

Financial Transactions
-stocks
-bonds
-real-estate

Gifts
-social security/transfer payment
-scholarship

WHAT IS COUNTED IN GDP

C- Consumption 
-67% of the economy 
-All finished goods and services

Ig- Gross Private Domestic Investment
- new factory equipment
-construction of housing 
-factory equipment machinery
-unsold inventory products built in at year

G-Government spending
- anytime gov't purchases goods and services

Xn- Net exports
-exports 
-imports


Wednesday, January 21, 2015

Business cycle

Business Cycle


Expansionary- Real out put in the economy is increasing and the unemployment rate is declining
ex. building houses

Peak- where real GDP is at its heights point

Contraction (rescission) - real out in the economy is decreasing, and the unemployment rate is rising or increasing

Trough- lowest point of real GDP

EPCT 1 business cycle from Trough to Trough

Supply

Supply Curve


supply is quantities that producers or sellers are willing and able to produce/sell at varies prices.

The Law of Supply: there is a direct relationship between price and quantity supplied

what causes a "change in quantity supplied"? (changesQS)
* Change in price

What causes a "change in supplied"?
1) change in technology
2) change in taxes or subsidies
3) change in the number of sellers
4) change in resources prices of cost of production
5) change in weather
6) change in expectations

% Change in Quantity
 new quantity - old quantity divided by old quantity

% change in Price
new price - old price divided by old price


PED
divide the % quantity by % price

TR= Prices x Quantity


Equilibrium- the point at which the supply curve and demand curve intersect


Shortage QD> QS
Surplus QS>QD


Price Floor- government has control on how low a price can be charged for a product


Price Ceiling- government has control on how high a price can be charged for a product

Friday, January 16, 2015

Demand


Demand Curve

Demand- is the quantities that people are willing and able to buy at various prices.

The Law of Demand-  there is an inverse between price and quantity demand
PQ

What causes change in demand?
1. change in buyers taste (advertisement)
2. change in the # of buyers (population)
3. change in income (normal goods, inferior goods)

  • Normal goods- goods that buyer buy more of when there income rise
  • Inferior goods- goods that buyers buy less of when there income rises

4. change in the price of related goods

  • substitute goods- goods that serve roughly the same purpose (ex. Coke and Pepsi)
  • complimentary goods- goods that are often consumed together (ex. fries and ketchup)
Elasticity Demand 
  1. elastic demand- a product that is elastic when demand will change quickly give small change in price (ex. steak, fur coat)
  2. inelastic demand- a product to say it is elastic if your demand for it will not change in price (e. milk, gas, medicine)
  3. Uni-elastic (ex. salt)

Possibility Curve


Attainable-  it is retrievable to produce trucks and boats


Point B- in the middle, always efficient . producing equal trucks and cars

Point A- efficient but producing more boats

Point C- efficient but producing more trucks

Point D- attainable inside curve but inefficient. under utilizing resources
1) decrease in the population 
2) under employment of unemployment
3)war, famine

Point E- Unattainable 
1) technology improvement
2) economic growth
3) discovering new resources

Key Assumptions
1. two goods are produced
2. full employment
3. fixed resources (land, labor, capital)
4. fixed state of technology
5. no international trade


Thursday, January 15, 2015

Unit 1 notes

Needs
- basic requirements for survival
ex. food, water, shelter

Wants
-broad requirements
ex. cell phone, TV, jewelry


Scarcity
- fundamental economic problem all societies face
- satisfying unlimited wants with limited resources
ex. water, oil

Shortage
-a situation where quantity demanded is greater than quantity supply
ex. go in store for juice, not there, get it another day

Goods
-tangible commodity, goods are bought, sold, traded and produced.

Consumer goods
- goods that are intended for final use of he consumer
ex. eating the chocolate bar

Capital goods
-items used in the creation of other goods, such as factory machinery and trucks.

Services
- work that is preformed for some one else

factors of production 
1. land
2. labor
3. capital
4. entrepreneurship

1. Land - natural resources
2. labor- work force
3. human capital- knowledge and skills a worker gains though education and experience
4. physical capital- human made objects used to create other goods and services
ex. buildings and tools

entrepreneurship- having a product, being a risk taker.


Macroeconomics Vs Microeconomics 
 
Macroeconomics
- The study of the major components of the economy
ex. inflation, supply and demand, wages and GDP

Microeconomics
- The study of house holds and firms make decisions in how they interact with the market

Positive Economics
- claims that attempt to describe the world as it is
-very descriptive
ex. minimum wage laws causes unemployment

Normative Economics
- claims that the attempt to predict prescribe how the world should be
-opinion based
ex. minimum wage increases

Trade Offs
- alternatives that we give up when we choose one course of action over another

Opportunity Cost 
- we are choosing our next best alternative

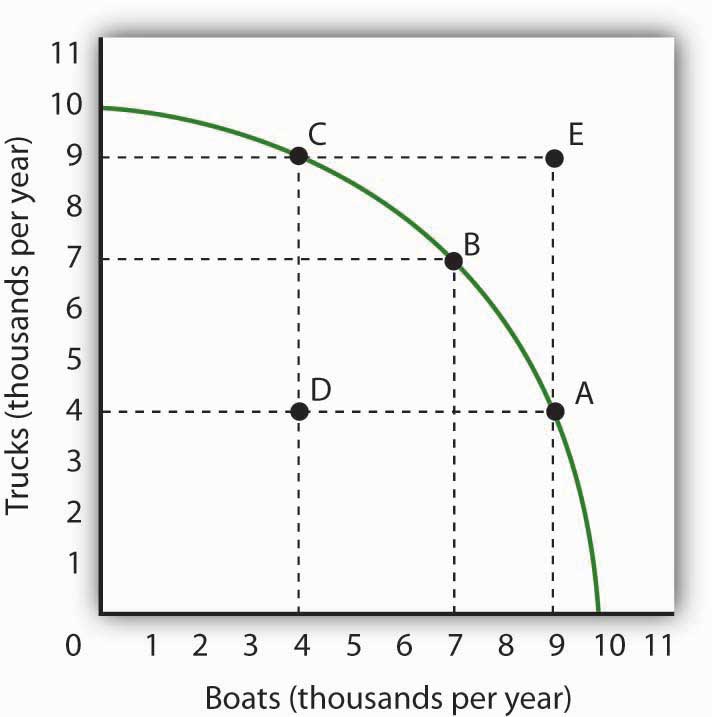
Production possibility curve
- shows the most that society can produce if it uses every available resource to the best of its ability